The JointJS diagramming library lets you create fully interactive diagramming tools for all modern browsers, relying only on JavaScript and SVG. Its MVC (more MV) architecture separates graph, element and link models from their rendering, which makes it easy to plug JointJS into your backend application. JointJS is not trying to reinvent the wheel for technologies that are commonly used by web developers; things that you learn with JointJS will be useful to you elsewhere.
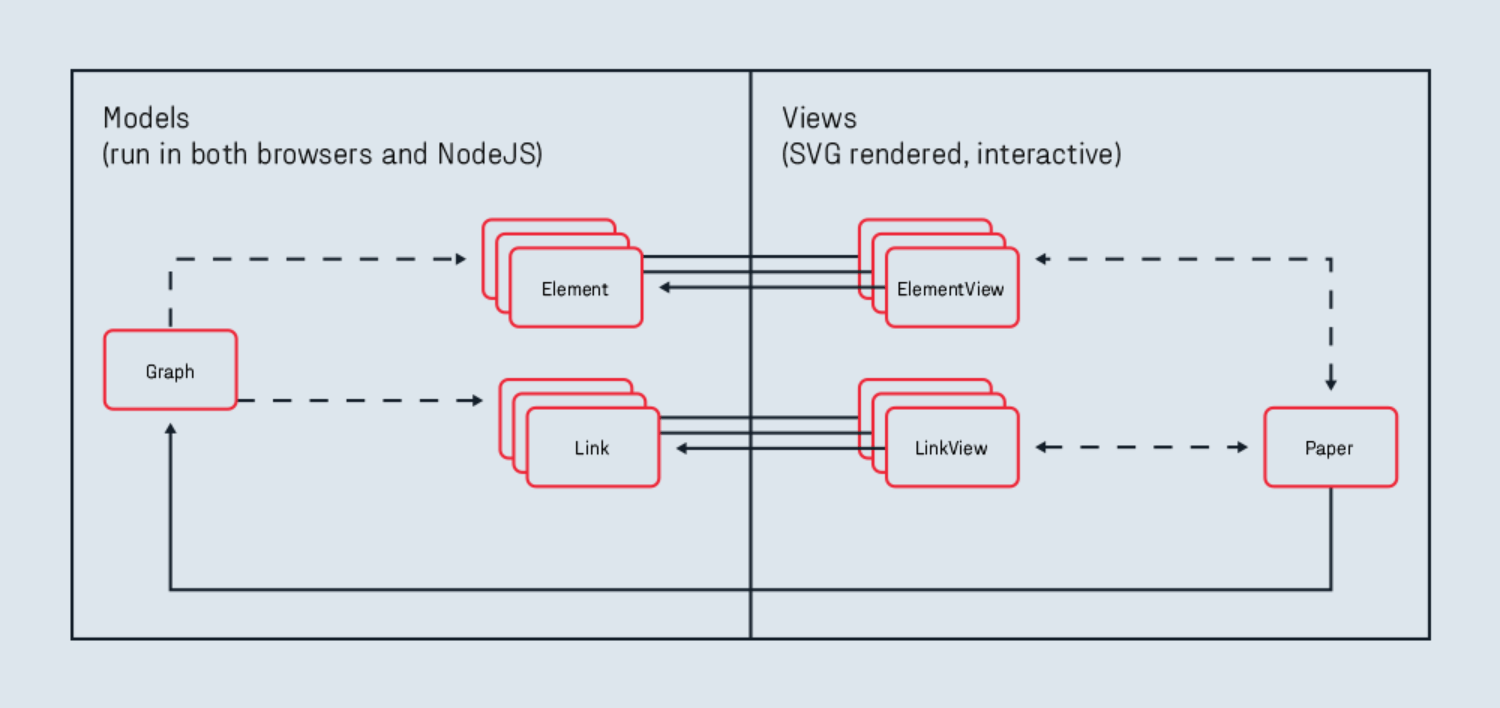
A diagram in JointJS is represented by a Graph model (joint.dia.Graph) to which you add
models of cells - either Elements (subtypes of joint.dia.Element) or Links (subtypes of
joint.dia.Link).
To present the diagram, attach it to a Paper view (joint.dia.Paper).
In JointJS, you manipulate models, not views; the paper generates ElementViews and
LinkViews for you from the data provided by the graph models.
The architecture is illustrated in the following diagram.
JointJS provides a visual library of common geometric shapes, as well as an extensive collection of ready-to-use components from several well-known diagramming languages (ERD, OrgChart, FSA, UML, PN, DEVS, ...). The JointJS framework has been designed with an eye towards modularity. This makes it easy for advanced users to create their own shapes and to extend built-in functionality with custom plugins. JointJS+, a commercial extension to JointJS, provides a number of pre-made plugins that extend its functionality with widgets, interactive components, and additional shapes (BPMN diagrams).
Let's learn how to create great diagrams with JointJS. We will start by examining a simple Hello, World! application together.
If you are already comfortable with the basics of JointJS, you can learn about some more complex concepts in the intermediate section of the tutorial.