🎉 JointJS has new documentation! 🥳
🎉 JointJS has new documentation! 🥳
This plugins imports a graph represented as an XML string in the GEXF format and makes it a JointJS graph.
The plugin contains only one function joint.format.gexf.toCellsArray(xmlString, makeElement, makeLink),
where xmlString is an XML string representing a graph in GEXF format, makeElement is a function that takes
an object with id, width, height and label properties and returns a JointJS shape for this node.
makeLink is a function that takes an object with source and target properties and returns
a JointJS link for that edge.
Include joint.format.gexf.js file into your HTML:
<script src="joint.format.gexf.js"></script>var cells = joint.format.gexf.toCellsArray(
someGEXF_XML_String,
function makeElement(attrs) {
return new joint.shapes.basic.Rect({
id: attrs.id,
size: { width: attrs.width, height: attrs.height },
attrs: { text: { text: attrs.label } }
});
},
function makeLink(attrs) {
return new joint.dia.Link({
source: { id: attrs.source },
target: { id: attrs.target }
});
}
);
graph.resetCells(cells);The Print plugin extends the joint.dia.Paper with the following method that, when called,
prepares the paper for printing and initiates printing using the browser print wizard:
print([options]) - prints the paper using the browser print dialog box.Where options is an object with the following possible values:
| sheet | object | Optional. Along with the sheetUnit, margin and marginUnit it defines the
output paper. sheet could be specified as an object: { width: [number], height: [number] }. It
defaults to size of the A4 - 210x297. This option
also sets the page orientation - landscape or portrait. For example A4 - landscape would be set as {
width: 297, height: 210 }
.
Example: 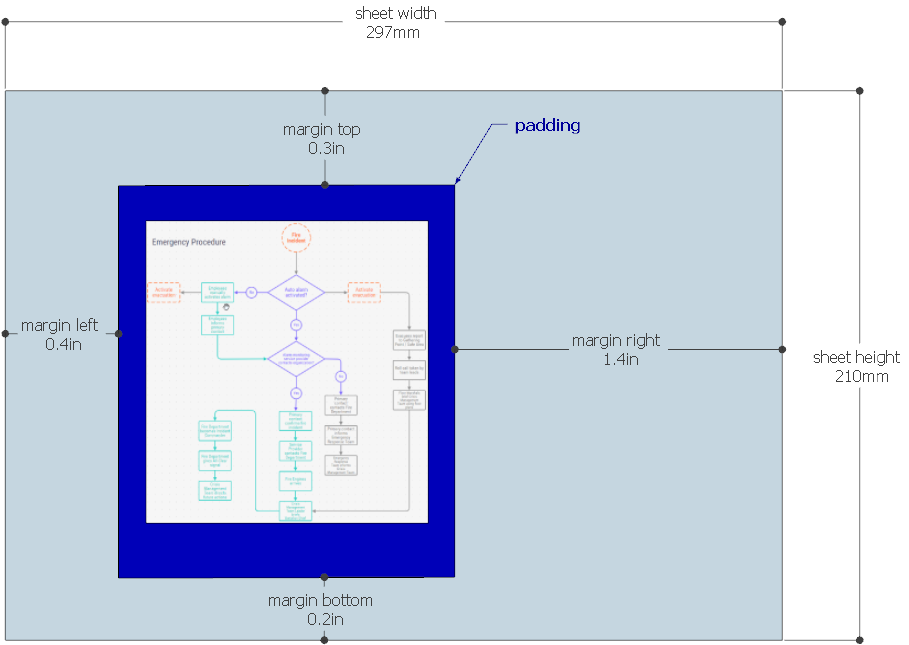
Please note, the |
|---|---|---|
| sheetUnit | string | Optional. Size unit for the sheet option. Supported units are mm, cm,
in, pt, pc. It defaults to mm
|
| area | object |
Optional. Custom area to be printed. Defined as {width: [number]: height: [number], x: [number], y:
[number] }. If the area is not defined, the whole graph is printed.
|
| ready | function | Optional. This callback function is triggered when the print content is ready for the actual print. At this moment it's possible to update the print content element (e.g. set some additional css styles) and pass this through. Or, it's also possible to cancel the print process. The prepared print content is a HTML element (multiple elements in case of the poster option). To cancel the print process pass falsy value into the readyToPrint callback (see the example below). This is useful if you need e.g. add a watermark or have a custom print preview UI widget.
|
| poster | boolean | object | Optional. Splits the area to be printed to pieces. Each piece will be printed on a separate page. poster can be defined either as { rows: [number], columns: [number] } or as { width: [number], height: [number] }. The first option (rows/columns) is a "table-style". It treats the print area to be a table and it divides it to defined amount of rows and columns. The width/height variant allows you to define the width and height of the piece. It defaults to false. |
| margin | number | object | Optional. The space on all sides of the paper area to be printed. The margin could
be also an object with the following properties for finer grained control of the margin on each side:
{ left: [number], top: [number], right: [number], bottom: [number] } |
| marginUnit | string | Optional. Size unit for the margin option. Supported units are mm, cm,
in, pt, pc. It defaults to in
|
| padding | number | object | Optional. This is applicable only if the option area is not set - when the whole graph is
printed. It's an extra space added to each side of the graph. The padding could
be also an object with the following properties for finer grained control of the padding on each side:
{ left: [number], top: [number], right: [number], bottom: [number] } |
Include print.css and joint.format.print.js files into your HTML:
<link rel="stylesheet" type="text/css" href="print.css">
<script src="joint.format.print.js"></script>$('#print-btn').click(function() {
paper.print({
padding: 10,
sheet: { width: 297, height: 210 },
poster: false,
margin: 1,
marginUnit: 'in',
ready: function(printAreaElements, readyToPrint) {
printAreaElements.forEach(function($el) {
$el.find('#paper').css('border', 'none');
});
readyToPrint(printAreaElements)
}
});
});
If you'd like to add your custom text or logo to all the printed papers, you can use the following method in your CSS:
@media print {
    body:before {
       content: 'My Cool Company';
       top: -5mm;
    }
}
This adds the text My Cool Company to the top of the printed document. For adding a logo image, just set
width, height and background-image properties on the :before
pseudo-element.
This plugin adds new methods to the joint.dia.Paper object for exporting paper to PNG and JPEG raster formats on
the client side:
| toPNG(callback [, options]) | Executes the callback function with a PNG data URI representing the content of the paper as the first parameter. |
| toJPEG(callback [, options]) | Executes the callback function with a JPEG data URI string representing the content of the paper as the first parameter. |
| toDataURL(callback [, options]) | The general version of two previous methods. Executes the callback function with a data URI string representing the content of the paper in specified MIME type as the first parameter. |
The available options are:
| width | number | Set the width of the image in pixels. |
| height | number | Set the height of the image in pixels. |
| size | number | Size multiplicator for generating raster images in a higher resolution. It expects a string in the form of [Number] + 'x' describing how many times the image width and height should be multipicated.
It defaults to '1x'.
|
| backgroundColor | string | The image background color. |
| padding | number | The space between the image border and the image content. It can also be an object with left, top, right and bottom properties
|
| type | string | The standard MIME type for the image format to return (only applies to toDataURL()).
|
| quality | number | The quality level of a JPEG image compression in the range of 0.0 to 1.0 (only applies to
toJPEG()).
|
| area | g.Rect | An area, that the resulting raster image should display. The value is an object, which contains x,y,width and height, describing the origin and the size of a rectangular area on the paper in the local coordinates. It defaults to the paper content bounding box - paper.getContentBBox() transformed into the local coordinates.
|
| useComputedStyles | boolean | The same behaviour as useComputedStyles in paper.prototype.toSVG(). |
| stylesheet | boolean | The same behaviour as stylesheet in paper.prototype.toSVG(). |
Note an exception 'dia.Paper: raster size exceeded' can be thrown if the raster size reaches the browser limits. In that case the raster size / resolution can be lowered through the size option e.g { size: '.5x' }.
Include joint.format.svg.js and joint.format.raster.js file into your HTML:
<script src="joint.format.raster.js"></script>(Note that this plugin requires the SVG Export.)
To get the plugin to work across all modern browsers include also canvg library and its dependencies. All these files are part of the Rappid toolkit, in the Raster/lib directory:
<script src="format/Raster/lib/rgbcolor.js"></script>
<script src="format/Raster/lib/StackBlur.js"></script>
<script src="format/Raster/lib/canvg.js"></script>paper.toPNG(function(imageData) { sendToServer(imageData); });
paper.toJPEG(function(imageData) { offerForDownload(imageData); }, {
width: 640,
height: 320,
quality: 0.7
});This plugins adds two new methods to the joint.dia.Paper object:
toSVG(callback[, opt]) - Converts the content of the paper to an SVG string and calls the callback with the SVG string as the first parameter.openAsSVG() - Opens a new window with SVG representing the content of the paper.Include joint.format.svg.js file into your HTML:
<script src="joint.format.svg.js"></script>paper.toSVG(function(svgString) {
sendToServer(svgString);
offerForDownload(svgString);
});The toSVG(callback[, opt]) method takes an option object opt with the following parameters:
| preserveDimensions | boolean | object | By default, the resulting SVG document has set width and height to 100%. If you'd like to have the dimensions to
be set to the actual content width and height, set preserveDimensions to true.
An object with width and height properties can be also used here if you need to define the export size explicitely.
|
| area | g.Rect | An area, that the resulting SVG should display. The value is an object, which contains x,y,width and height, describing the origin and the size of a rectangular area on the paper in the local coordinates. It defaults to the paper content bounding box - paper.getContentBBox() transformed into the local coordinates.
|
| convertImagesToDataUris | boolean | Converts all contained images into Data URI format. It defaults to false. |
| useComputedStyles | boolean |
When set to When set to |
| stylesheet | string |
A stylesheet (as string) can be provided and appended to the resulting SVG export. It defaults to |